

Routing Data (Container Map GeoJSON API) is a paid feature. These APIs are subject to additional terms of usage and pricing. If you are interested in using these APIs, please contact sales@terminal49.com.
Table of contents
- Overview
- Getting started
- Understanding the response
- Building your map
- Use cases
- Recommendations and best practices
- Frequently asked questions
Overview
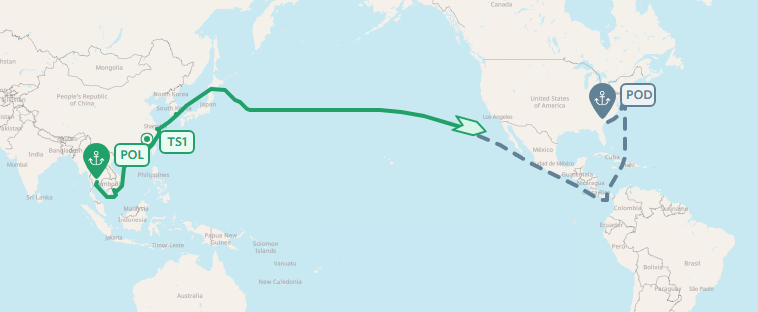
TheGET /v2/containers/{id}/map_geojson endpoint provides all the map-related data for a container in a single GeoJSON response.
The endpoint returns a GeoJSON FeatureCollection containing:
- Port locations (Point geometries): Port of lading (POL), port of discharge (POD), and transshipment ports (TS1, TS2, etc.)
- Current vessel location (Point geometry): The current position of the vessel if the container is currently at sea
- Past vessel paths (LineString geometries): Historical positions of vessels for completed and in-progress legs of the journey
- Estimated future paths (LineString geometries): Predicted vessel routes for upcoming or in-progress legs
Getting started
To retrieve the map data for a container, make a simple GET request to the endpoint:Request
Example Response Overview
Example Response Overview
Understanding the response
GeoJSON FeatureCollection structure
The response follows the GeoJSON specification and contains:type: Always"FeatureCollection"features: An array of GeoJSON Feature objects, each representing a map element (port, vessel, or route path)
type: Always"Feature"geometry: A GeoJSON geometry object (Point or LineString)properties: An object containing metadata specific to the feature type
Feature types
Theproperties.feature_type field identifies what each feature represents. The following feature types are available:
Port
Geometry Type:Point
Port features represent all ports in the container’s route: the port of lading (POL), port of discharge (POD), and any transshipment ports (TS1, TS2, etc.).
Port Feature Example
Port Feature Example
Port Feature Properties
Port Feature Properties
Current vessel
Geometry Type:Point
This feature is only present when the container is currently on a vessel at sea. It represents the vessel’s current position.
Current Vessel Feature Example
Current Vessel Feature Example
Current Vessel Feature Properties
Current Vessel Feature Properties
Past vessel locations
Geometry Type:LineString
These features represent the actual historical paths taken by vessels for completed and in-progress legs of the journey. Each LineString contains a series of coordinates showing where the vessel traveled between two ports.
Past Vessel Locations Feature Example
Past Vessel Locations Feature Example
Past Vessel Locations Properties
Past Vessel Locations Properties
Estimated full leg
Geometry Type:LineString
These features represent predicted vessel paths for future legs that have not yet started. The LineString shows the estimated route between two ports.
Estimated Full Leg Feature Example
Estimated Full Leg Feature Example
Estimated Full Leg Properties
Estimated Full Leg Properties
Estimated partial leg
Geometry Type:LineString
This feature represents the predicted path from the vessel’s current position to the next port. It is only present when the container is currently on a vessel at sea.
Estimated Partial Leg Feature Example
Estimated Partial Leg Feature Example
Estimated Partial Leg Properties
Estimated Partial Leg Properties
current_vessel feature. The LineString starts from the vessel’s current position (which matches the current_vessel feature coordinates) and extends to the next port.
Building your map
To visualize a container’s journey using the GeoJSON response on your own map (similar to the embeddable map):- Load the GeoJSON data into your mapping library (Leaflet, Mapbox GL, Google Maps, etc.)
-
Filter features by type to style them differently:
- Ports: Display as markers with labels (POL, POD, TS1, etc.)
- Current vessel: Display as a special marker (e.g., a ship icon) with vessel information
- Past vessel locations: Display as solid lines (representing completed journeys)
- Estimated partial leg and Estimated full legs: Display as dashed lines (representing future predictions)
-
Use the properties to add interactivity:
- Show port details (name, country, timestamps) on click/hover
- Display vessel information (name, IMO, speed, heading) for the current vessel
- Show leg information (departure/arrival times, vessel ID) for path segments
Example: Using Leaflet.js
Example: Using Leaflet.js
Use cases
Integrating Terminal49’s Vessel and Container Route APIs enables a variety of advanced capabilities:- Track Complete Shipment Journeys Visually: Monitor shipments across multiple legs on a map, from the port of lading to the port of discharge, including all transshipment points.
- Identify Transshipment Details Geographically: Clearly see where transshipments occur and the routes taken between them.
- Correlate Timestamps with Locations: Visually connect ETDs, ETAs, ATDs, and ATAs for every leg with their geographical points on the map for precise planning and exception management.
- Improve Internal Logistics Dashboards: Offer your operations team a clear visual overview of all ongoing shipments and their current locations.
Recommendations and best practices
- Polling Intervals: For active containers (currently at sea), refresh the map data up to once per hour to get updated vessel positions. For containers that have completed their journey, you can cache the data as it won’t change.
-
Error Handling: Implement proper error handling for API requests. If a container doesn’t have route data yet, the endpoint will return an empty FeatureCollection (
{"type": "FeatureCollection", "features": []}).
- Data Layering: Consider layering information on your map. Start with basic port markers and paths, then add details like vessel names, ETAs, or status on hover or click.
- Map Library Integration: Use a robust mapping library (e.g., Leaflet, Mapbox GL, Google Maps, OpenLayers) to handle the rendering of markers, lines, and map interactivity.
-
Styling Guidelines:
- Use distinct colors/styles for different feature types (ports, current vessel, past paths, estimated paths)
- Consider using dashed lines for estimated paths and solid lines for completed paths
- Add labels to port markers showing POL, POD, TS1, etc.
- Display vessel information in popups or info panels
-
Data Interpretation:
- The
ports_sequenceproperty helps you understand the order of ports in the journey - Use
inbound_ata_atandoutbound_atd_atto determine which legs are completed - The presence of a
current_vesselfeature indicates the container is currently at sea
- The
-
Handling Antimeridian Crossings: When container routes cross the International Date Line (antimeridian at ±180° longitude), standard map projections can display routes incorrectly, showing lines that wrap around the entire globe. For mapping libraries that don’t natively handle antimeridian crossings, the recommended approach is to: (1) detect and split crossing LineStrings into separate segments, and (2) render map features across multiple world views (standard, East, and West) as needed. Below are more details:
- Detection: Identify LineString features (past vessel locations or estimated paths) that cross the antimeridian by checking if consecutive coordinates have a longitude difference greater than 180°.
-
Single Crossing Solution: When one antimeridian crossing is detected:
- Split the route into two segments: features before the crossing (based on
ports_sequence) are drawn in the standard world view - Features after the crossing are drawn in an extended world view (East or West, depending on crossing direction)
- Split the crossing LineString into two separate lines: one ending at the antimeridian in the standard view, and one starting from the antimeridian in the extended view
- Split the route into two segments: features before the crossing (based on
- Multiple Crossings: For routes with more than one antimeridian crossing (rare but possible), render all features across three world views (standard, East, and West) with duplicated features. Split all crossing lines to prevent lines from wrapping across the globe.
- No Crossings: If no antimeridian crossings are detected, render all features in the standard world view without any special handling.
Frequently asked questions
Q: How up-to-date is the vessel position data? A: Vessel location data is updated every 15 minutes, although that does not guarantee there will be a new position every 15 minutes due to factors like whether the vessel is transmitting or within range of a satellite or base station. Q: How accurate are the future predictions? A: Predicted future positions are based on algorithms and historical data. Their accuracy can vary based on many factors such as temporary deviations, weather conditions, seasonality, or how frequently the shipping lane is used. Q: What if a vessel deviates from the predicted path? A: Predicted paths are estimates. The historical path (once available as apast_vessel_locations feature) will show the actual route taken. Regularly refreshing data for active shipments is key to getting the most accurate information.
Q: Why don’t I see a current_vessel feature for my container?
A: The current_vessel feature is only present when:
- The container is currently on a vessel at sea
- The vessel has departed from a port (
outbound_atd_atis present) - The next port hasn’t been reached yet (
inbound_ata_atis not present) - A valid vessel location can be retrieved
[longitude, latitude] in WGS84 (EPSG:4326) format.
Q: Are the LineString coordinates simplified?
A: The endpoint applies simplification to reduce the number of points in LineStrings for better performance. The simplification tolerance can vary, but the paths remain accurate for visualization purposes.